Civic data portal
The numbers behind WarayWaray reporting
Explore prices, power systems, public infrastructure, and regional economic indicators. The goal is simple: make public data easier to question, compare, and use.
WarayWaray uses data as a starting point for better regional questions.
Many public datasets are technically available but difficult to read in context. This portal brings the useful pieces together: economic indicators, electricity prices, public works spending, energy capacity, and practical tools for household decisions.
Use the portal to compare places, spot outliers, and understand whether a claim is a pattern or a one-off observation. It is built for readers, researchers, local advocates, journalists, and anyone who wants Eastern Visayas discussed with evidence rather than guesswork.
Economics
Economics Dashboard
Compare inflation, price indices, electricity prices, and GRDP per capita across regions and provinces. This is the place to ask how Eastern Visayas compares, and where provincial differences become visible.
Energy
Energy & Utilities
Track distribution utility prices, sales, peak demand, power plant capacity, and regional energy constraints. The energy view helps connect household costs with the systems behind them.
Solar
Solar Planning Tool
Estimate household solar options and understand the tradeoffs behind system size, batteries, costs, and reliability. It is practical support for people dealing with expensive or unstable electricity.
What you can explore
Regional questions, organized for comparison
The portal is organized around questions that come up again and again in WarayWaray research. Each topic is meant to make comparisons easier before an article goes deeper.
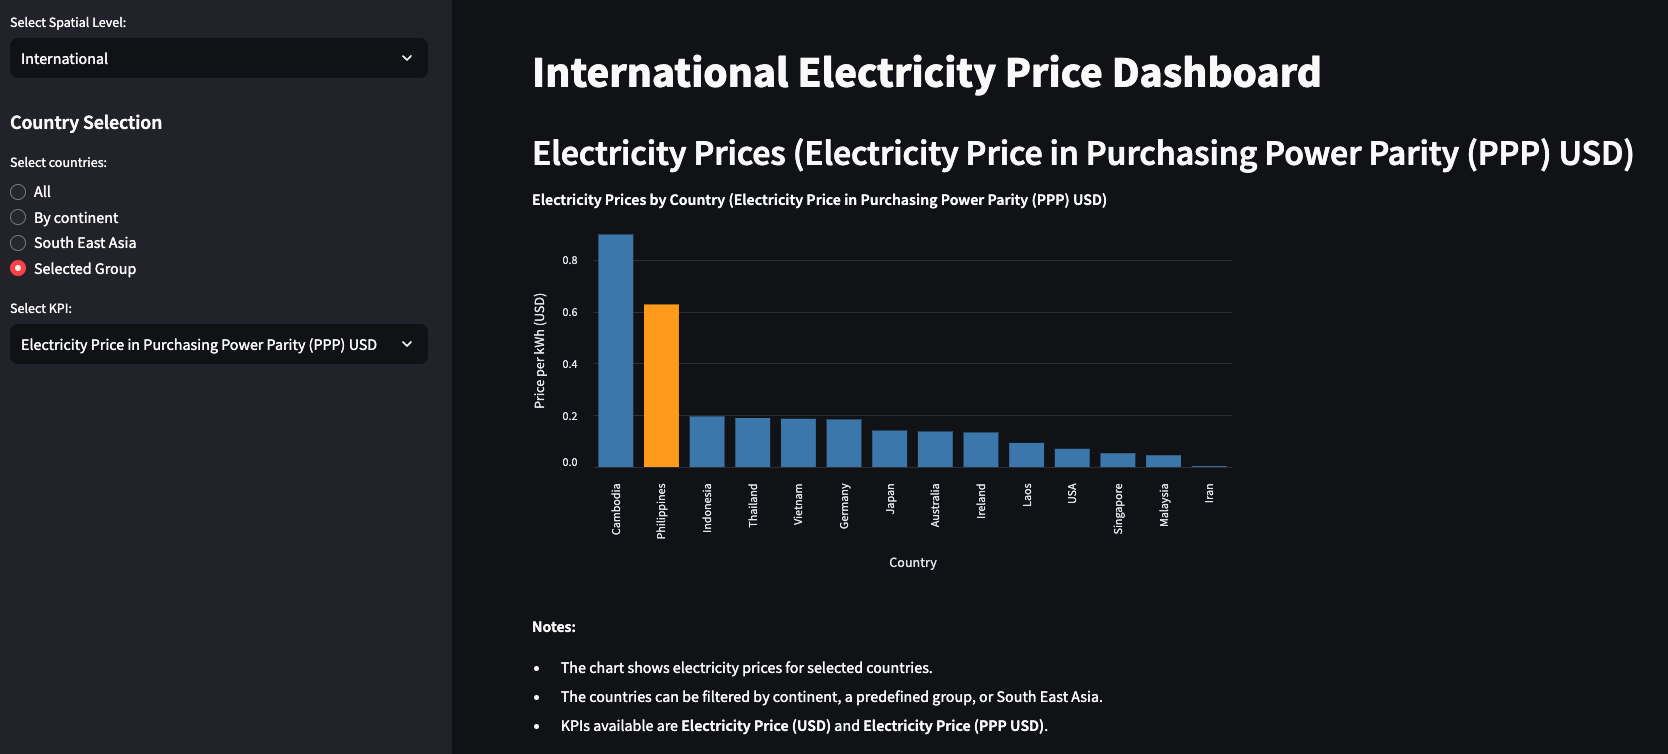
- Electricity prices by distribution utility Compare what households pay across utilities and over time.
- Provincial inflation trends See where prices are moving faster, slower, or differently from nearby provinces.
- GRDP per capita by region Put regional economic output into a wider national comparison.
- DPWH project spending by province and category Examine where public infrastructure budgets are concentrated.
- Active power plant capacity Understand the generation mix behind regional supply discussions.
- Regional comparisons against national averages Separate local reality from national headline numbers.
Data sources
Built from public records and cleaned local datasets
Current datasets draw from Philippine public sources including PSA OpenSTAT, PSA regional accounts, energy-sector data, DPWH project records, and WarayWaray cleaned datasets.
When possible, datasets are kept close to their public source and transformed only enough to support comparison, charts, and article research.
Method note
Readable, not magical
Datasets are cleaned for comparison and may simplify source categories. Some figures depend on reporting periods, definitions, and source completeness.
Read this as a guide for inquiry, not as a final official record. The strongest conclusions still need context, local knowledge, and careful follow-up.